Framekit templates
Start from a designer-made template
 Use template
 Use template
 Use template
 Use template
 Use template
 Use template
 Use template
 Use template
Visme is one of those tools people describe by listing what it does rather than what it is for. Presentations, infographics, reports, charts, social graphics, forms, whiteboards.
That breadth is the reason it gets shortlisted and also the reason people start hunting for Visme alternatives about four months in, usually after one of two moments.
The first moment is the export. You finish a sixteen-page client report on the free plan, hit download, and there is a watermark on every page. The second is the invoice.
Visme's headline price is $12.25 a month, which is the annual rate; paying monthly costs $29, which is 2.4 times as much for the same software.
A Visme alternative is a visual content tool that covers more than one document type - slides, reports, infographics, and social assets - from a single template system and brand kit, so a small team is not paying for four separate subscriptions.
The best Visme alternative in 2026 for decks and chart-led reports is Framekit Slides, because it imports a spreadsheet into editable charts, writes and lays out slides from a description, and exports PDF on a free plan with unlimited decks, all in the same account as your website.
The honest trade-off: it makes no infographics, social graphics or print layouts, so if Visme was your whole design toolkit, Canva ($144 a year against Visme Pro's $297) is the better swap.
Adobe Express is the best free option with no watermark, Piktochart the pick for infographics, and Figma for layout control.
Full disclosure: Framekit is our own product and it is ranked first, so read that with care. We rebuilt the same report in the ten other tools, reviewed Framekit from its shipped features and published pricing rather than the same rebuild, link to every one, and score Framekit 5 out of 10 on coverage, the lowest of the top six; Canva, Piktochart and Affinity Publisher beat us on the document types we do not make.
Re-verified on 19 September 2026: Framekit's Slides features and plan prices were checked and it was re-ranked from eleventh; competitor prices are as read in August 2026.
How We Compared These Visme Alternatives
We rebuilt the same brief in ten tools, and reviewed Framekit Slides, our own product, from its shipped features and published plans rather than the same hands-on rebuild: a sixteen-page monthly client report with six charts, a brand-consistent cover, a two-page executive summary, four data spreads, and an appendix table.
The carried scenario is a two-person marketing consultancy producing one of these reports a month, one quarterly pitch deck, and roughly eight social graphics a month.
Coverage. Does the tool actually replace Visme's breadth, or does it replace one slice of it and leave you buying a second subscription?
Charts. Visme's chart engine is its strongest single feature, so every alternative was scored on whether it can import a spreadsheet, render six chart types, and keep them editable.
What the free plan really gives you. Specifically whether exports carry a watermark, because that single policy decides whether a free tier is a product or a demo.
Export fidelity. We exported every rebuild to PDF and, where offered, to .pptx and HTML5, then opened each on a machine that had never seen the source fonts.
Cost for one person and for two, at both monthly and annual rates, because the gap between those two numbers is unusually wide in this category.
Kept separate, so you can discount whichever you trust least. Measured by us: the ten rebuilds, the chart tests, the export opens, and the watermark checks.
Read from primary sources: every price in this guide, taken from the vendors' own pricing pages during August 2026, linked inline where the number does real work.
Attributed to others: patterns in public reviews, which we mark as reviewer sentiment rather than findings.
What Ten Rebuilds Told Us About This Category
Rebuilding one report ten times surfaces things a feature grid hides. The most useful finding was about free plans, and it is not the one we expected.
- 3 of 10 free plans export with no branding of any kind. Visme's does not. Framekit's free plan, per its plan page, adds a small Made with Framekit credit in each slide's corner.
- 5 of 10 import a spreadsheet and keep the chart editable afterwards. Framekit Slides' documented chart import reads CSV, TSV and .xlsx files into editable charts.
- The monthly-versus-annual penalty ranged from 1.0x to 2.6x. Visme's is 2.4x.
- 2 of 11 export interactive HTML you can host on your own domain.
- Annual cost for one person ran from $0 to $300; for two people, from $0 to $600.
- The single best-value finding in the batch: Affinity Publisher is now free, which puts a professional page-layout application at zero cost against Visme Pro's $297 a year.
Visme Alternatives Compared
Weighting, published so you can argue with it: coverage 25%, export fidelity 20%, charts 20%, price 20%, ease of use 15%. Charts carry a fifth of the score because that is the capability Visme users are most likely to miss, and several otherwise strong tools score badly on it.
Framekit and Canva finish 0.1 apart, and the order is decided by charts and price, where Framekit scores 9 and 10, against coverage, where it scores 5 to Canva's 10. If you use Visme for social graphics or infographics, that coverage gap decides it and Canva is your pick.
| Tool | Free plan exports | Entry price (annual) | Charts from a spreadsheet | HTML export | Our rating |
|---|---|---|---|---|---|
| Visme | Watermarked | $147/yr | Yes | Pro only | - |
| Framekit Slides | Small corner credit | $84/yr | Yes, CSV or .xlsx | Hosted link only | 8.9/10 |
| Canva | Clean | $144/yr | Basic | No | 8.8/10 |
| Adobe Express | Clean | $119.88/yr | Basic | No | 8.4/10 |
| Piktochart | Watermarked | $120/yr | Yes | No | 8.1/10 |
| Venngage | Watermarked | $120/yr | Yes | Team plan | 7.8/10 |
| Figma | Clean | $192/yr | No, manual | No | 7.7/10 |
| Gamma | Clean | $108/yr | Basic | Hosted only | 7.6/10 |
| Infogram | Watermarked | $300/yr | Yes | Yes | 7.3/10 |
| Beautiful.ai | None | $144/yr | Yes | No | 7.2/10 |
| Affinity Publisher | Free outright | $0 | No, manual | No | 7.1/10 |
| Google Slides | Clean | $0 | Yes, via Sheets | Published link | 6.9/10 |
Framekit's entry price is Starter billed yearly, per Framekit's pricing page; the free plan exports PDF with the credit line.
1. Framekit Slides: Best Visme Alternative for Decks and Chart-Led Reports

Best forstudios, consultancies and freelancers whose Visme account was mostly decks, pitch documents and chart-heavy reports sent as a link or a PDF.
Framekit is an AI website builder that also ships Slides, a deck tool in the same account as your site, client galleries, video review and a digital-product store.
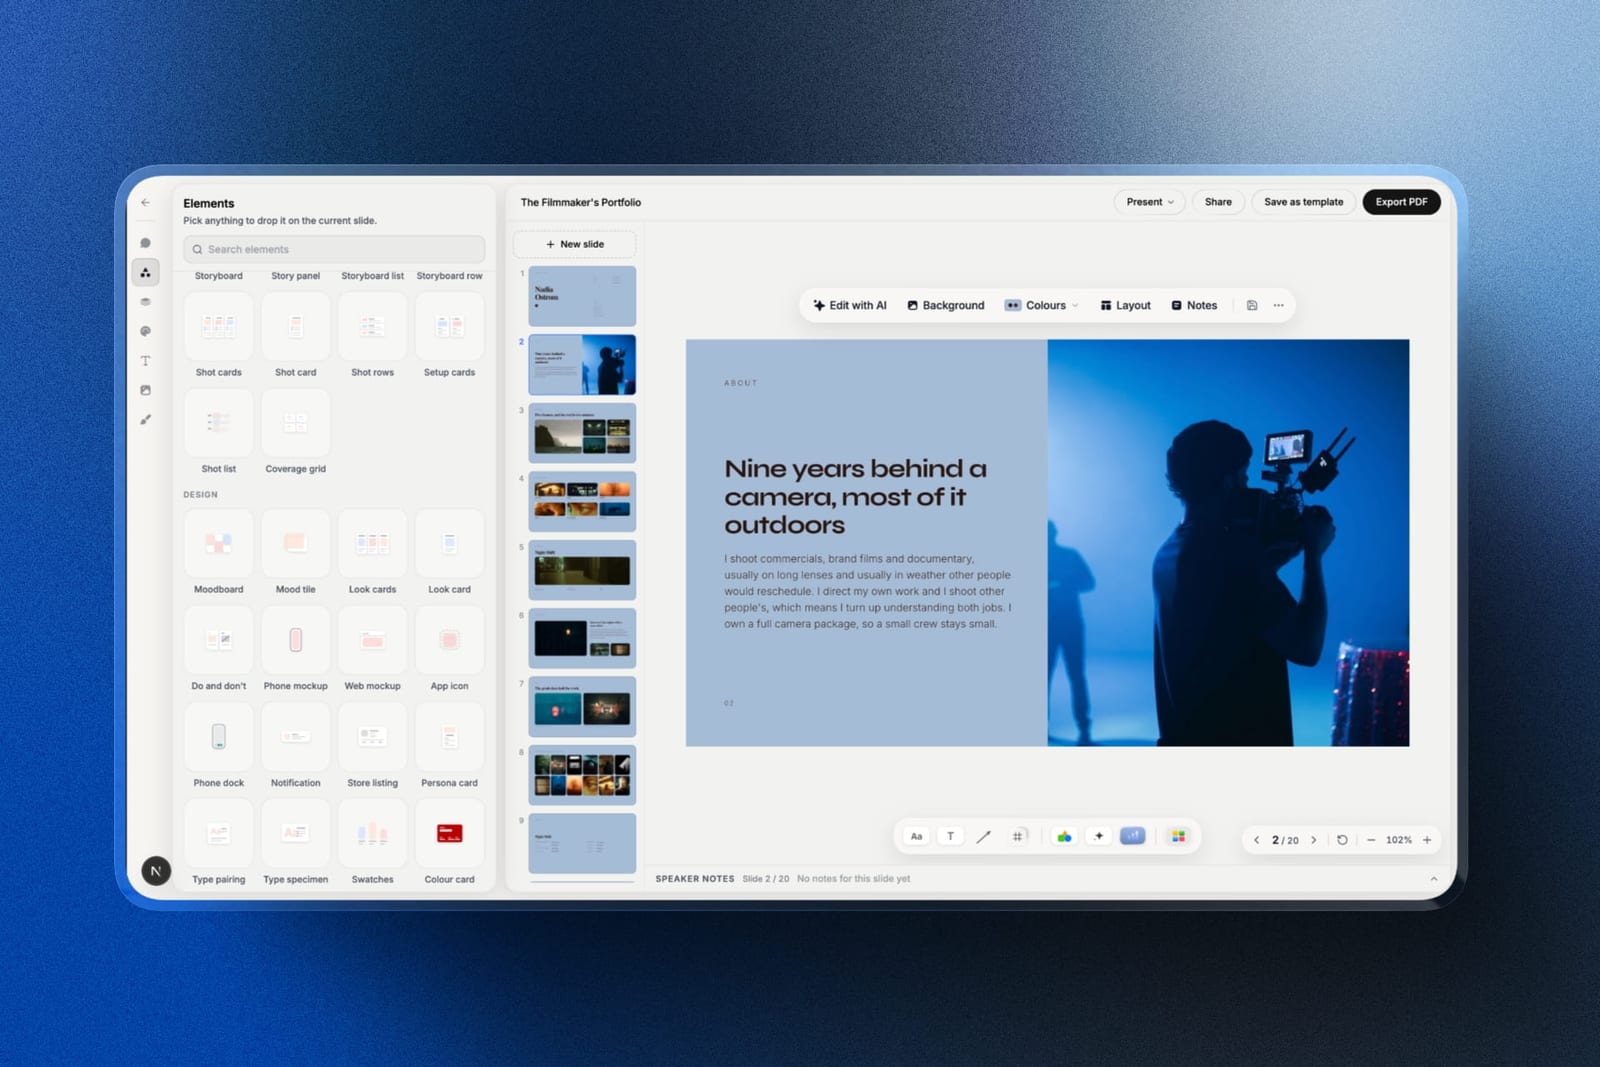
For a Visme user, the chart feature is the headline: you drag a CSV, TSV or .xlsx export onto a chart, pick the sheet if the workbook has several, and it becomes an editable column, bar, line, area, pie or donut chart rather than a picture, so next month's report is a new file dropped onto the same charts.
Tables, timelines and roadmaps come from the same data editor.
For the prose pages, the AI writes and lays out a slide from a description ("two-column executive summary with three key numbers") and everything stays editable by hand, which is roughly how Gamma works but inside a fixed page rather than a scrolling card.
The real number$0 for unlimited decks with PDF export, against Visme Pro at $297 a year.
The free plan adds a small "Made with Framekit" credit in the corner of each slide; removing it, uploading brand fonts, and the full template library start on Starter at $84 a year billed yearly.
For our two-person consultancy, Pro at $180 a year includes three team members, against $594 for two Visme Pro seats.
The standout detailchart import reads CSV, TSV and .xlsx files directly in the browser, up to 60 rows, and refuses a workbook cell it cannot read rather than guessing. That is the right behaviour for a client report, where a silently wrong number is worse than an error.
The gotchaFramekit covers less of Visme than Canva does. There are no infographic templates, no social-graphic sizes, and no print layout with master pages, so the eight monthly social graphics in our scenario still need another tool.
The .pptx export (Pro and up) is picture-based, so a client cannot edit the text.
Skip it ifyour Visme work is mostly infographics or social assets, or your report has to go to print. Canva and Affinity Publisher, below, are the better fit.
Verdict: the best Visme replacement when the output is a deck or a data-led report read on a screen, and a partial one when Visme was your whole design department. Start a report deck free at framekit.ai/slides.
2. Canva: The Best Visme Alternative for Breadth
Best foralmost everyone leaving Visme, unless charts are the reason you were there.
Canva covers Visme's full surface area and then some: the report, the deck, the social set, and the printed leave-behind all came out of one account with one brand kit.
Our sixteen-page rebuild took thirty-five minutes against Visme's fifty, and most of that difference was navigation rather than design work, because Canva's editor surfaces fewer options at once.
The template library is not a marginal advantage. Searching "quarterly marketing report" in Visme returned a handful of usable starting points; the same search in Canva returned enough that the problem became choosing rather than finding.
The real numberCanva Pro is $18 a month or $144 a year, which is $153 a year less than Visme Pro at $297.
For our two-person consultancy, Canva Teams at $25 per user per month is $600 a year, against two Visme Pro seats at $594, so the saving disappears at exactly two people. That is worth knowing before you migrate a team.
The standout detailCanva's Magic Switch converts a finished document into a different format - the report into a deck, the deck into a social carousel - with layout intact rather than as a dumb resize.
For a consultancy that ships the same insight in three formats every month, this removed roughly a third of our production time.
The gotchathe chart engine is the weak point and it is a real regression from Visme. Canva charts accept pasted data or a linked sheet but offer far fewer types, less control over axes, and no conditional formatting. Our six-chart report lost two of its chart types and had to substitute.
Skip it ifyour documents are 60% data visualisation. You will spend the saved money on a second tool.
What reviewers say elsewhereCanva holds 4.7 out of 5 from over 6,000 reviews on Capterra, where breadth and template quality dominate the positive reviews.
Verdict: the correct default for anyone who used maybe 40% of Visme. It is cheaper for one person, level at two, and better at everything except charts.
3. Adobe Express: The Best Free Visme Alternative
Best forpeople whose entire objection to Visme is the free-plan watermark.
This is the finding that changes most people's shortlist. Adobe Express's free plan exports without a watermark, includes over 100,000 templates, 5GB of storage, and 25 generative credits a month.
Our full sixteen-page report came out of the free tier as a clean PDF with nothing stamped on it, which is not true of Visme, Piktochart, Venngage, or Infogram.
The editor is fast and slightly shallow. It is best understood as Adobe's answer to Canva rather than to Visme, so it is strong on social assets and single-page layouts and thinner on long multi-page documents.
The real numberAdobe Express Premium is $9.99 a month with no annual commitment, so there is effectively no monthly penalty.
Teams starts at $4.99 per licence a month for the first year and renews at $7.99, with a two-seat minimum, which makes our two-person consultancy about $192 a year after renewal.
The gotchathe sixteen-page report was the hardest rebuild here to keep coherent. Express handles pages but does not really think in documents, so master pages, running headers, and consistent page numbering all had to be done by hand.
Skip it ifyour main output is a long report rather than a deck or a graphic.
Verdict: the best free option on this page by a clear margin, purely because the exports are clean. If you were on Visme's free plan and fighting the watermark, this is a straight upgrade for nothing.

4. Piktochart: Best for Infographics and Reports
Best forteams whose Visme use was 80% infographics.
Piktochart is the most direct like-for-like swap in this comparison. Same shape of product, same template categories, same emphasis on turning a dataset into something a non-analyst will read.
Our rebuild was the closest visual match to the Visme original of any tool here, and it took the same amount of time, which is a compliment and a warning.
The real numberPiktochart Pro is $10 per member a month billed annually, which is $120 a year and $27 cheaper than Visme Starter, or $15 a month billed monthly. For two people that is $240 a year against Visme's $294.
The standout detailPiktochart's report templates assume a real narrative structure - executive summary, findings, methodology, appendix - rather than being decorated page layouts. For a monthly client report that structure is most of the work.
The gotchathe free plan watermarks exports, exactly like Visme's, so if that was your complaint this does not solve it. It also has a noticeably smaller template library than Canva, and the AI features are thinner than the marketing implies.
Skip it ifyou need decks and social assets as well. Piktochart is narrower than Visme, deliberately.
Verdict: the right pick when your Visme subscription was really an infographic subscription. Slightly cheaper, equally good at the core job, and it does not pretend to cover the rest.
5. Venngage: Best for Template-Led Business Documents
Best forconsultancies producing recurring business documents where speed beats originality.
Venngage's library leans heavily toward the documents small businesses actually make: proposals, one-pagers, org charts, timelines, and reports.
Our rebuild started from a template that already had an executive summary and an appendix, and finishing it took twenty-eight minutes, the fastest of the ten.
The real numberVenngage Standard is $10 a month billed annually, or $19 monthly, which is $120 a year. The Team plan is $24 per user a month annually, $288 a year each, and that is the tier where HTML and PowerPoint export live.
The gotchaexport format is tied to plan tier in a way that catches people out. PowerPoint and HTML export require the Team plan at $288 per user a year, so a solo user on Standard is limited to PNG and PDF.
If your workflow ends with handing a client an editable deck, the real price is more than double the headline.
Skip it ifyour brand needs to look distinctive. The templates are effective and widely used, and it shows.
Verdict: the fastest route from brief to finished business document, with a tier structure that puts the export you probably need behind the team price. Good for volume, weak for distinction.
6. Figma: Best for Design Control
Best foranyone whose real complaint about Visme is that it would not let them do the thing they could picture.
Every tool above is a template system with an escape hatch. Figma is the opposite: a design tool with templates bolted on.
The sixteen-page report rebuild took ninety minutes, the longest here, and produced by far the best-looking result, with type and grid control that nothing else on this page approaches.
The real numbera Figma Professional Full seat is $16 a month billed annually, or $192 a year.
The detail worth knowing is the Collab seat at $3 a month annually, which gives full editing in FigJam and Figma Slides but no design-file editing, so a two-person consultancy where only one person designs pays $192 plus $36, not $384.
The gotchano chart engine at all. Every one of our six charts had to be built by hand or pasted in from elsewhere as an image, which for a data-heavy monthly report is a serious ongoing tax rather than a one-time setup cost.
Skip it ifyou make charts every week. This is the wrong end of the trade.
Verdict: the highest ceiling and the highest cost in effort. Correct if you left Visme frustrated by constraints, wrong if you left it over price.
7. Gamma: Best AI-First Alternative
Best forthe report you have to produce on Thursday and have not started.
Gamma turned a paragraph of brief plus a pasted data table into a structured sixteen-section document in under two minutes. Roughly two thirds of it was usable, the rest was generic, and the editing pass took twenty minutes.
As a way to get past a blank page it has no equal on this list.
The real numberGamma Plus is $108 a year, the cheapest paid tier here, and the free plan is credit-limited rather than watermarked, so exports are clean.
The gotchathe output is a web-native card layout, not a page layout. It looks excellent as a link and mediocre as a PDF, and page breaks land where the cards end rather than where a designer would put them. For a report that gets printed or filed, this matters.
Skip it ifthe finished artefact is a paginated document rather than a link.
Verdict: the fastest tool on this page and the least suited to formal reporting. Use it for the draft, move it if the client wants a file.
8. Infogram: Best for Live Data Visuals
Best forreports whose charts need to update themselves.
Infogram is the only tool here where a chart can be connected to a live data source and keep refreshing after publication.
For a monthly client report that is mostly a performance dashboard, that changes the job from producing a document to maintaining one, which is a much smaller task twelve times a year.
The real numberInfogram Pro starts at $25 a month, with Business at $79 and Team at $179, so it is the most expensive option here at $300 a year for one person. The free plan watermarks and restricts downloads.
The gotchaeverything that is not a chart is weaker than Visme. Page layout, typography, and template variety are all a step behind, so a report that is 40% narrative will look worse than the Visme version even as the charts look better.
Skip it ifyour documents are mostly words.
Verdict: buy it for the live-data capability and nothing else. If that capability is not on your list, it is the wrong price for what it does.
9. Beautiful.ai: Best for Consistent Decks
Best forthe quarterly pitch deck half of a Visme subscription, not the report half.
Beautiful.ai's constrained layouts made our quarterly deck rebuild both fast and hard to get wrong, and made the sixteen-page report awkward, because the tool thinks in slides rather than pages. It is a partial replacement chosen deliberately.
The real numberPro is $144 a year for one person and Team is $40 per user a month, which is $960 a year for two. There is a One-Time Project plan at $45 for a single deck without any subscription, which is the sensible way to try it.
The gotchathe chart types are good and the data entry is manual. There is no spreadsheet link, so every monthly refresh means retyping numbers, which for a recurring report is exactly the wrong workflow.
Skip it ifyour documents repeat monthly with new data.
Verdict: strong for the deck, poor for the report, and priced steeply the moment a colleague needs access. A partial answer that knows it is partial.
10. Affinity Publisher: Best for Print-Grade Documents
Best foranyone producing long documents who is tired of paying monthly for the privilege.
Here is the fact that should reorder several shortlists. Affinity's applications, including Publisher, are now free following Canva's acquisition of Serif, which puts a professional page-layout tool with master pages, proper typographic control, and CMYK output at zero cost.
Our sixteen-page report is the kind of document Publisher was built for, and it was the best-typeset rebuild of the ten.
The gotchait is a desktop application with a real learning curve, no template marketplace to speak of, no collaboration, no web publishing, and no chart engine. You are trading convenience for control and paying in time rather than money.
Skip it iftwo people need to work on the same document, or you need it done this afternoon.
Verdict: the best value on this page by a wide margin and the worst fit for a hurried team. If your monthly report is a serious document with a long shelf life, this is a genuinely free professional answer.
11. Google Slides: Best Free Presentation Floor
Best forthe part of your Visme use that was just making slides.
Google Slides replaces the deck portion of Visme for nothing, works on every machine, and lets clients comment without an account.
Its charts link to Google Sheets and refresh when the sheet changes, which is a quietly good answer to the recurring-report problem and one that costs zero dollars.
The gotchait is not a document tool. The sixteen-page report rebuilt in Slides is a sixteen-slide deck pretending to be a report, and it reads that way when printed.
Verdict: the free floor. If your Visme usage was slides plus a Sheets-linked chart, you have been paying $147 a year for something Google gives away.
What Visme Costs Against the Alternatives Over Two Years
The monthly-versus-annual gap is unusually wide across this category, and it is the number most comparisons skip. Below, one person over two years at the annual rate, and the same person paying monthly, because a lot of freelancers do.
| Tool | 2 years, annual billing | 2 years, monthly billing | Monthly penalty |
|---|---|---|---|
| Affinity Publisher | $0 | $0 | None; it is free |
| Google Slides | $0 | $0 | None |
| Framekit Free, or Starter | $0 or $168 | $0 or $216 | 1.3x on Starter |
| Gamma Plus | $216 | Not verified | Not verified |
| Piktochart Pro | $240 | $360 | 1.5x |
| Venngage Standard | $240 | $456 | 1.9x |
| Adobe Express Premium | $239.76 | $239.76 | None |
| Canva Pro | $288 | $360 | 1.25x |
| Beautiful.ai Pro | $288 | $360 | 1.25x |
| Visme Starter | $294 | $696 | 2.4x |
| Figma Professional | $384 | $480 | 1.25x |
| Visme Pro | $594 | $1,416 | 2.4x |
| Infogram Pro | $600 | $600 | None |
A test worth running before you switch. Open your Visme account and count how many finished projects you made in the last six months, then sort them by type.
If more than two thirds are one type - all infographics, or all decks, or all social - you are paying for breadth you are not using, and the narrower tool for that type will be cheaper and better.
Breadth is only worth paying for when you genuinely use three or more of the categories.
In one lineVisme's annual pricing is competitive and its monthly pricing is not, so the real decision for most people is whether the breadth justifies $297 a year against Canva's $144 and Adobe Express's clean free tier.
Which Visme Alternative Should You Pick?
Work through these in order and stop at the first yes, since each question removes the tools that fail a hard requirement before the softer preferences ever come into it.
1. Is most of what you make in Visme decks, pitch documents or chart-led reports read on a screen? If yes, Framekit Slides. Spreadsheet charts stay editable, PDF export is free, and the deck sits next to your website.
2. Was the watermark on free exports your actual complaint, and you need social graphics too? If yes, Adobe Express. Its free tier exports clean, which solves the whole problem for nothing.
3. Are more than half your projects infographics? If yes, Piktochart if they are static, Infogram if they need to update themselves after publishing.
4. Do you make three or more different document types every month? If yes, Canva. It is the only tool here with genuinely comparable breadth to Visme.
5. Are you producing a long, printed, typeset document? If yes, Affinity Publisher, which is now free and better at that job than anything else on this list.
6. Did you leave because the templates would not let you do what you pictured? If yes, Figma, on a Full seat, and budget for handling charts elsewhere.
7. Do you need a draft in the next fifteen minutes? If yes, Gamma.
8. Do several people make documents and quality varies? If yes, Venngage for business documents or Beautiful.ai for decks, checking which export you need against the plan tier.
9. Is the finished thing only ever opened as a link and never changes? Then it probably wanted to be a page on your own domain rather than a document at all, which Framekit's website builder handles in the same account.
Frequently Asked Questions
What is the best Visme alternative in 2026?
The best Visme alternative in 2026 for decks and chart-led reports is Framekit Slides, which imports CSV and .xlsx data into editable charts, lays out slides from a description, and exports PDF on a free plan with unlimited decks.
If you also use Visme for infographics and social graphics, Canva is the better all-round replacement at $144 a year against Visme Pro's $297.
Is there a free alternative to Visme without a watermark?
Adobe Express is the best free Visme alternative that exports without a watermark, and its free plan includes over 100,000 templates and 5GB of storage.
Google Slides also exports clean and free, and Affinity Publisher is now free outright following Canva's acquisition of Serif, which makes it the strongest zero-cost option for long documents.
How much does Visme cost in 2026?
Visme Starter is $12.25 a month billed annually, which is $147 a year, or $29 a month billed monthly. Visme Pro is $24.75 a month annually, which is $297 a year, or $59 monthly.
The Basic plan is free but watermarks every export, and Enterprise pricing is custom and starts at ten users.
Is Canva better than Visme?
Canva is better than Visme for template variety, breadth of document types, and price at one seat, costing $144 a year against Visme Pro's $297.
Visme is better for charts and data visualisation, where its chart engine offers more types and more control, so data-heavy reporting teams often find the move to Canva a downgrade in that one area.
Which Visme alternative is best for infographics?
Piktochart is the best Visme alternative for infographics, with a comparable template library focused on data storytelling and a Pro plan at $120 a year against Visme Starter's $147.
Infogram is the better pick when charts need to stay connected to a live data source and update after publication.
Does Visme watermark free exports?
Visme watermarks every export on its free Basic plan, including PDFs and images, which effectively makes the free tier a demonstration rather than a usable product for client work.
Adobe Express, Google Slides, Gamma, Figma, and Canva's free tier all export without a watermark, and Framekit's free plan exports decks with only a small corner credit rather than a watermark across the page.
Visme vs Canva: which is cheaper for a two-person team?
For two people the two tools are almost level: Canva Teams is $25 per user per month, which is $600 a year, and two Visme Pro seats cost $594 a year.
Canva is meaningfully cheaper for a single user, at $144 against $297, so the saving from switching disappears at exactly the point a second person joins.
Can Visme documents be exported to PowerPoint?
Visme exports to PowerPoint on paid plans, and its Pro tier also exports interactive HTML5 that you can host yourself, which is unusual in this category. On the free Basic plan every export is watermarked, so a clean .pptx requires at least the Starter plan at $147 a year.
Is Affinity Publisher really free now?
Affinity's applications, including Publisher, are free following Canva's acquisition of Serif, which puts a professional page-layout tool with master pages and print-grade output at zero cost.
It has no templates marketplace, no collaboration, and no chart engine, so it replaces the document-craft half of Visme rather than the whole product.
Which alternative is best for recurring monthly reports?
Infogram is the best fit for recurring monthly reports because its charts can stay connected to a live data source, so the next month's report is a refresh rather than a rebuild.
Google Slides is the free equivalent of that idea using charts linked to Google Sheets, and Framekit Slides lets you drop next month's CSV or .xlsx export onto the same charts, though neither Framekit nor Canva keeps a live connection.
Should a client report be a document or a web page?
A client report should be a web page when it is only ever opened as a link and never printed or filed, because a page can be updated in place and found in search.
It should stay a document when the client's finance or procurement process requires a fixed, dated, downloadable file, which is still the norm in most corporate reporting.
A shared deck link with a PDF export, as Framekit Slides gives you, covers both cases from one file.
What does Framekit not replace from Visme?
The non-deck half, which is most of why some teams bought Visme. There are no infographic templates, no preset social-graphic sizes and no print layout with master pages, so eight monthly social graphics still need another tool.
The .pptx export from Pro is picture-based, so a client can present the file but not edit the text in it.
What it does replace, and cheaply, is the deck and chart-led report work: unlimited decks with PDF export at $0 against Visme Pro at $297 a year, and Pro at $180 a year including three team members against $594 for two Visme seats.
Final Verdict
Framekit Slides is the Visme alternative we would move a deck-and-report workflow to, because it keeps the thing Visme users miss most, charts built from a spreadsheet that stay editable, adds an AI slide writer, and costs nothing until you want your own fonts and no credit line.
Canva is the move for everyone whose Visme account was a whole design department, and the honest reason is breadth at a lower price rather than superiority on any single axis.
Adobe Express is the answer if the watermark was the issue, because its free tier simply does not have one. Piktochart is the narrower, cheaper swap for infographic-led teams.
And the most surprising result of this whole comparison is that Affinity Publisher, a genuinely professional page-layout application, now costs nothing.
Where Framekit losesFramekit is not for infographics, social graphics or print-grade page layout, and it does not keep charts connected to live data the way Infogram does.
Its PowerPoint export (Pro and up) is picture-based, and the free plan carries a small credit line. If any of those is the job, Canva, Piktochart, Infogram or Affinity Publisher is the better fit.
If you take one number away, take the 2.4x. Paying Visme monthly rather than annually costs $549 more over two years on the Pro plan, which is more than most of the alternatives cost outright.
Related reading: our guide to the best Canva alternatives, the best free graphic design software, the best presentation software, and the best mockup generators.
All figures here reflect published vendor pricing as read in August 2026. Several of these tools changed tier structure within the last year, so treat any number older than a quarter as a starting point rather than a quote.